Spring Season Recap
First, thanks for being a part of the Behind the Numbers community in the first season of this column. The change in format seems to be a success, judging by the number of weekly views and my rapid increase in Twitter followers. The community is why I take time out of my week to do this.
The Behind the Numbers Team ended with a total score of 1618 and an OR of 172. Didn’t quite reach our ambitious goals, but we’re definitely trending upward. Sadly, however, our quest for the MLSFB Scarf for the scarf wall must continue for another season.
Spring Season Data Review
The sortable stats in the game leave a lot to be desired, so I wanted to did into the Spring Season data as a look back at who performed well and where the pockets of value may be going into the fall season. I hope you’re ready for way too many colorful tables.
Spring Season Performance
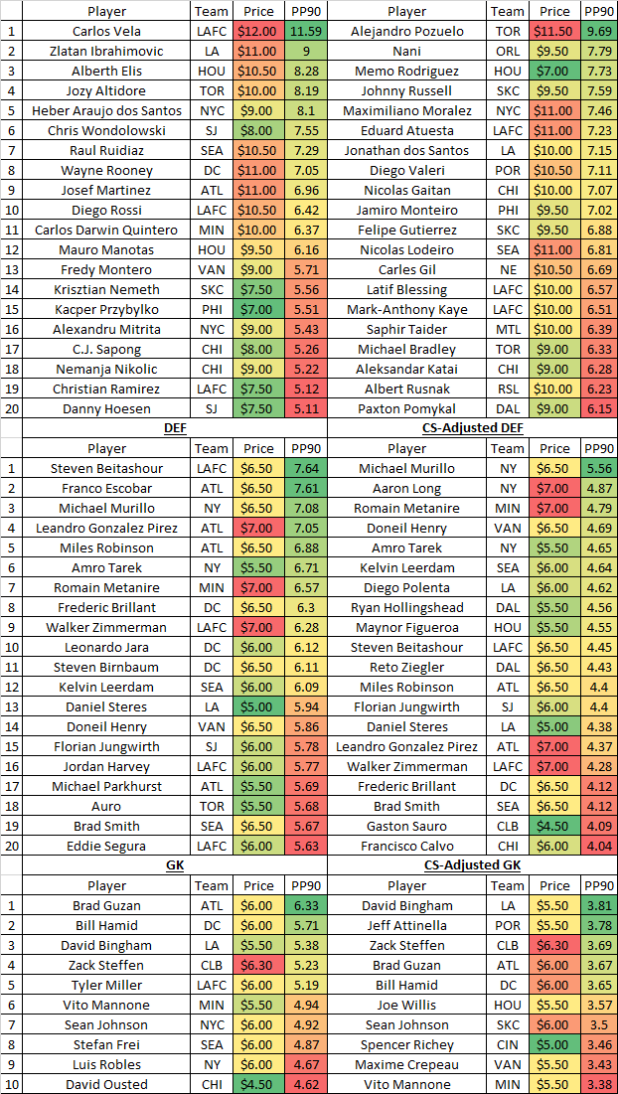
First, let’s take a look at PP90 (Points/90 min played). This is one of the best stats for grading players across different amounts of play time. For this, I filtered out players with less than 800 min played on the season, with a few exceptions. You’ll also see a “CS-Adjusted” metric. For this, I simply removed the clean sheet points to look at players underlying metrics.
Next, I’ve given the same treatment to bonus point production in converting it to per 90 numbers (BPP90)
Finding value in the Fall Season
With the prices resetting, we’re all back to tight budgets with many of our budget players no longer budget friendly. The first metric I use to find value is PP90/$. How many PP90 are you getting for your money? This at least somewhat factors in your budget and the associated opportunity costs.
Another way to look for value is to look at the league a whole and try to project the expected production or price for a player would be given their price or production in the spring season. So below, I’ve calculated the xPrice of each player, based on a regression of the player’s value vs PP90.
Finally, let’s look at the guys who have played less than 800 min. These guys tend to be model breakers due to their small sample size, but if they were to get a starting role going forward, the underlying numbers say, WATCH OUT.
Resources for nerding out about MLS Fantasy
- http://www.mlscheatsheet.com/ — Bonus point data, projections and more
- https://www.americansocceranalysis.com/asa-xgoals — Interactive xG and passing data
- https://www.whoscored.com/ — Analytics based player ratings
 MLS Fantasy Boss A Fantasy MLS Community


